| (%i1) | 1+4; |

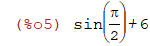
| (%i5) | 3! + sin(pi/2); |
That's not what I wanted!! [Use Cell menu and select "insert text cell" to
write non-math comments. Then select "insert input cell", to get back to math.]
| (%i7) | 3! + sin(%pi/2); |

| (%i9) | exp(log(6)); |

So, log is the command for the natural log, that is log base e. For other bases use the change of base formula.
Next we do three derivatives, a simple first derivative, a thrid derivative, and that a second partial derivative.
| (%i12) | diff(cos(x^2)+x^7-tan(exp(x)),x); |

| (%i13) | diff(cos(x^2),x,3); |

| (%i15) | diff(sin(x*y)+x^2y^3,y,2); |
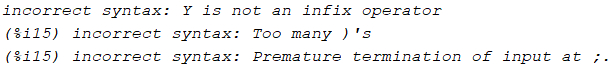
That error message is awful! What want wrong? I left out the * in x^2 * y^3.
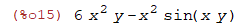
| (%i15) | diff(sin(x*y)+x^2*y^3,y,2); |
Next up, integration.
| (%i17) | integrate(x^2,x); |

It forgot the +C. Minus 1 point.
| (%i18) | integrate(cos(x^2),x); |
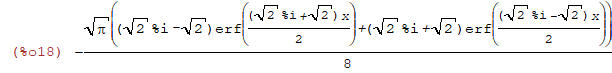
When something lke this happens it means the function does not have an anti-derivative that can be expressed in closed form.
| (%i19) | integrate(x*cos(x^2),x); |
| (%i64) | integrate(x*cos(x^2),x,3,7); |
| (%i65) | float(%); |

Series and limits.
| (%i27) | powerseries(exp(x^2),x,0); |
| (%i28) | powerseries(x*sin(x),x,0); |
| (%i29) | limit(1/x,x,infinity); |

| (%i31) | limit(sin(2*x)/sin(3*x),x,0); |

Now some basic graphing. The plot will appear in a pop up window. You have to close this window before going on.
| (%i45) | plot2d(sin(x^2),[x,0,10]); |

| --> | plot2d([cos(x),sin(3*x)],[x,0,4*%pi]); |

| (%i43) | load(implicit_plot)$ |
| (%i44) | implicit_plot(x^4+y^4=1,[x,-2,2],[y,-2,2]); |

| (%i61) | plot2d([parametric, sin(t), cos(3*t), [t, 0, 2*%pi]],[nticks,100]); |

| --> | plot3d(sin(x*y),[x,0,1*%pi],[y,0,1*%pi]); |

| (%i62) | plot3d([4-x^2-y^2,6-2*x-2*y,[x,-3,3],[y,-3,3]]); |

| --> |