Find the area inside the loop given by r(t)=<sin(Pi*t),t-t^4> for 0 ≤ t≤ 1, as shown below.
| (%i4) | wxplot2d( [parametric, sin(t·%pi),t−t^4], [t,0,1], [color,black]); |
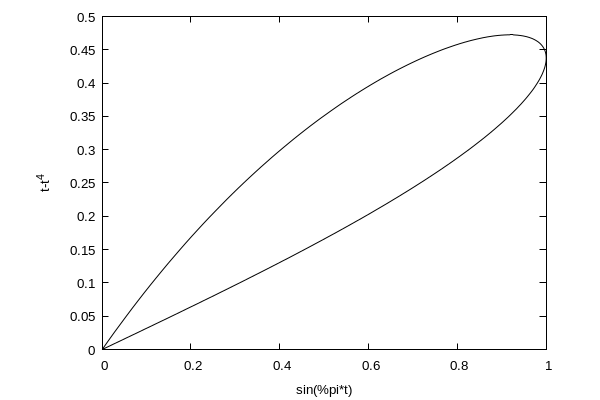
First we use Green's Theorem. Let F = <M,N> be the vector field given by N = x and M=0. Now area = int int (1) dA = int int (dN/dx - dM/dy) dA = (by Green's Theorem) int M dx + N dy = int x(t) y'(t) dt for t from 0 to 1.
Since y(t) = t - t^4, we get that y'(t) = 1 - 4t^3.
| (%i6) | integrate(sin(%pi·t)·(1−4·t^3),t,0,1); |
| (%i7) | float(%); |
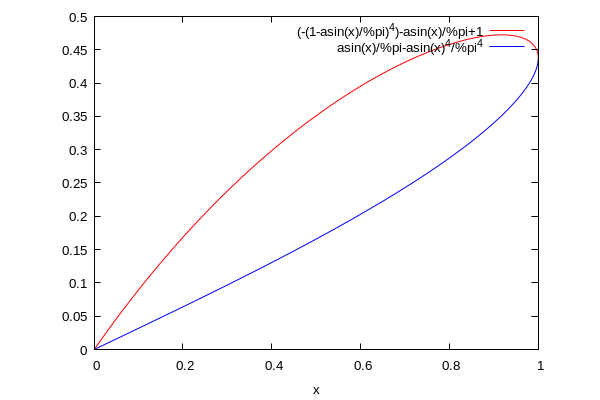
Using Calc I methods you would need to define y1(x) for the top curve and y2(x) for the bottom curve and then integrate y1(x)-y2(x) for x = 0 to 1.
This is done below. See if you can figure out how to find y1 and y2. (Finding y2 is easier.)
| (%i12) | y1(x) := 1−1/%pi·asin(x)−(1−1/%pi·asin(x))^4; |
| (%i13) | y2(x) := 1/%pi·asin(x)−(1/%pi·asin(x))^4; |
| (%i14) | wxplot2d([y1(x),y2(x)],[x,0,1],[color,red,blue]); |
| (%i17) | integrate(y1(x)−y2(x),x,0,1); |
| (%i18) | float(%); |