Heat Equation Example: f(r,theta) = r(1-r^2)sin(3theta)^2.
Switching over to cylindrical coords, but had to make my own with z=f(r,theta).
| > | addcoords(zcylindrical,[z,r,theta],[r*cos(theta),r*sin(theta),z],
[[1],[Pi],[0],[0..2,0..2*Pi,-1..1],[-4..4,-4..4,-4..4]]); |
Setting up my own color scheme b/c maple will change it to whatever it wants.
| > | B:= z -> piecewise(z<0.6, 1.0, -z/0.4 + 2.5 ); |
![]()
| > | R:= z -> piecewise(z<0.4, z/0.4, 1.0); |
![]()
| > | plot([R(z),B(z)],z=0..1,color=[red,blue]); |
![[Plot]](Images/HeatDisk2_3.gif)
Plotting z=f(r,theta), polar coords, my colors.
| > | f:= (r,theta) -> r*(1-r^2)*sin(3*theta)^2; |
![]()
| > | plot3d(f(r,theta), r=0..1,theta=0..2*Pi,view=0..0.5,coords=zcylindrical,numpoints=10000,
color=[R(f(r,theta)/0.4) ,0, B(f(r,theta)/0.4)]); |
![[Plot]](Images/HeatDisk2_5.gif)
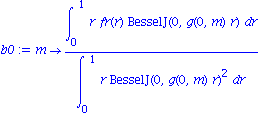
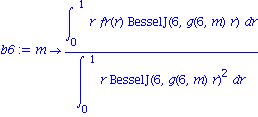
Working out the Fourier-Bessel series coeffs.
| > | fr := (r) -> r*(1-r^2); |
![]()
| > | g := (n,m) -> evalf(BesselJZeros(n,m)); |
![]()
| > | b0 := m -> (int(r*fr(r)*BesselJ(0,g(0,m)*r) ,r=0..1))/(int(r*BesselJ(0,g(0,m)*r)^2 ,r=0..1)); |

| > | b6 := m -> (int(r*fr(r)*BesselJ(6,g(6,m)*r) ,r=0..1))/(int(r*BesselJ(6,g(6,m)*r)^2 ,r=0..1)); |

Setting up the Fourier-Bessel series for t=0.
| > | M:=10: # Experiment with different values for M. |
| > | U0 := (r,theta) -> 1/2*sum( b0(m)*BesselJ(0,g(0,m)*r) ,m=1..M) - 1/2*cos(6*theta)*sum( b6(m)*BesselJ(6,g(6,m)*r), m=1..M); |
![]()
| > | plot3d(U0(r,theta),r=0..1,theta=0..2*Pi,coords=zcylindrical,view=0..0.5,
color=[R(U0(r,theta)/0.4), 0, B (U0(r,theta)/0.4)],numpoints=10000); |
![[Plot]](Images/HeatDisk2_11.gif)
Setting up Fourier-Bessel series for any time t.
| > | M:=10: |
| > | U := (r,theta,t) -> 1/2*sum( b0(m)*BesselJ(0,g(0,m)*r)*exp(-g(0,m)^2*t) ,m=1..M) - 1/2*cos(6*theta)*sum( b6(m)*BesselJ(6,g(6,m)*r)*exp(-g(6,m)^2*t), m=1..M); |
![]()
| > |
| > | plot3d(U(r,theta,0.001),r=0..1,theta=0..2*Pi,coords=zcylindrical,view=0..0.5,
color=[R(U(r,theta,0.001)/0.4) , 0,B( U(r,theta,0.001)/0.4) ],numpoints=10000,title="t=0.001"); |
![[Plot]](Images/HeatDisk2_13.gif)
| > | plot3d(U(r,theta,0.003),r=0..1,theta=0..2*Pi,coords=zcylindrical,view=0..0.5,
color=[R(U(r,theta,0.003)/0.4) , 0,B( U(r,theta,0.003)/0.4) ],numpoints=10000,title="t=0.003"); |
![[Plot]](Images/HeatDisk2_14.gif)
| > | plot3d(U(r,theta,0.005),r=0..1,theta=0..2*Pi,coords=zcylindrical,view=0..0.5,
color=[R(U(r,theta,0.005)/0.4) , 0,B( U(r,theta,0.005)/0.4) ],numpoints=10000,title="t=0.005"); |
![[Plot]](Images/HeatDisk2_15.gif)
| > | plot3d(U(r,theta,0.01),r=0..1,theta=0..2*Pi,coords=zcylindrical,view=0..0.5,
color=[R(U(r,theta,0.01)/0.4) , 0,B( U(r,theta,0.01)/0.4) ],numpoints=10000,title="t=0.01"); |
![[Plot]](Images/HeatDisk2_16.gif)
| > | plot3d(U(r,theta,0.02),r=0..1,theta=0..2*Pi,coords=zcylindrical,view=0..0.5,
color=[R(U(r,theta,0.02)/0.4) , 0,B( U(r,theta,0.02)/0.4) ],numpoints=10000,title="t=0.02"); |
![[Plot]](Images/HeatDisk2_17.gif)
| > | plot3d(U(r,theta,0.05),r=0..1,theta=0..2*Pi,coords=zcylindrical,view=0..0.5,color=[R(U(r,theta,0.05)/0.4) , 0,B( U(r,theta,0.05)/0.4) ],numpoints=10000,title="t=0.05"); |
![[Plot]](Images/HeatDisk2_18.gif)
| > | plot3d(U(r,theta,0.1),r=0..1,theta=0..2*Pi,coords=zcylindrical,view=0..0.5,color=[R(U(r,theta,0.1)/0.4) , 0,B( U(r,theta,0.1)/0.4) ],numpoints=10000,title="t=0.1"); |
![[Plot]](Images/HeatDisk2_19.gif)
| > | with(plots): |
Warning, the name changecoords has been redefined
| > | animate(plot3d,[U(r,theta,t),r=0..1,theta=0..2*Pi,coords=zcylindrical,view=0..0.5,color=[R(U(r,theta,t)/0.4) , 0,B( U(r,theta,t)/0.4) ],numpoints=1000 ],t=0..0.1); |
![[Plot]](Images/HeatDisk2_20.gif)
| > |